

Wide Stopband Attenuation Design of 5G Cavity Lowpass Filters
Power amplifiers (PAs) in 5G transmit paths inevitably generate 2nd, 3rd, and higher-order harmonic and wideband spurious components alongside the desired output signal. Without suppression, these violate the spurious emission limits of 3GPP TS 38.104 for base stations and interfere with adjacent frequency bands. Cavity Lowpass Filters (Cavity LPFs) — offering low insertion loss, high power handling, and excellent shielding — are the key hardware solution for harmonic suppression and wideband noise management. This paper focuses on Wide Stopband Attenuation as the core metric, systematically clarifying the physical distinction and design trade-offs between stopband attenuation and insertion loss (IL); comparing the effects of Chebyshev and Elliptic filter responses on cutoff roll-off and transmission zeros; reviewing multi-section cascade, spurious mode management, and Stepped Impedance Resonator (SIR) techniques; and using the Temwell STLP series as a practical case study. A regulatory-driven specification framework is proposed as an industry design reference.
1. Introduction: Lowpass Filters in Harmonic Suppression and Noise Management
In the 5G transmit path, the power amplifier (PA) is the primary source of nonlinear distortion. In addition to the desired output signal, the PA generates 2nd, 3rd, and higher-order harmonics; if these are not effectively suppressed, they interfere with adjacent frequency bands and violate 3GPP regulatory requirements.
Cavity Lowpass Filters (Cavity LPFs) are the core components addressing this problem, serving two main functions:
- Harmonic Suppression: Suppress the 2nd and 3rd harmonics at the PA output to below regulatory limits.
- Wideband Noise Management: Suppress broadband spurious emissions in the transmit path to maintain spectral purity.
3GPP TS 38.104 explicitly specifies spurious emission limits for 5G NR base stations: −57 dBm (100 kHz measurement bandwidth) in the 30 MHz–1 GHz range; −47 dBm (1 MHz measurement bandwidth) in the 1 GHz–12.75 GHz range, with some bands requiring test extension to the 5th harmonic or 12.75 GHz. Positioned at the 5G transmit front-end, the Cavity LPF is the most direct hardware solution for meeting these regulatory targets. The design priority is not to set the cutoff as low as possible, but to achieve the optimal balance among passband loss, transition slope, stopband attenuation, power handling, size, and cost.
2. Attenuation Definitions: Fundamental Distinction Between Stopband Attenuation and Insertion Loss
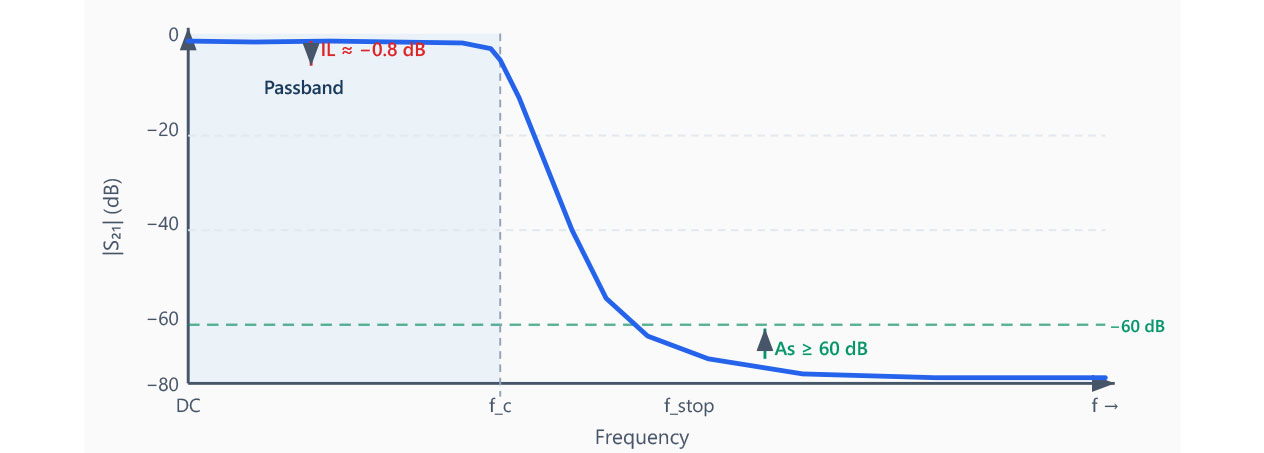
In RF filter specifications, the term "attenuation" is often used ambiguously. However, Insertion Loss (IL) and Stopband Attenuation (As) differ fundamentally in physical meaning and design objectives, and must be clearly distinguished. Figure 1 marks both on a single S21 curve.
2.1 Insertion Loss (IL)
Insertion Loss describes energy loss within the passband — the attenuation of the useful signal after passing through the filter:
Lower values are better; ideally approaching 0 dB. A typical excellent standard is ≤ 0.5 dB; values exceeding 3 dB indicate poor design. Sources include conductor loss, dielectric loss, and mismatch loss.
2.2 Stopband Attenuation (As)
Stopband Attenuation describes the suppression capability against unwanted signals in the stopband:
Higher values are better, indicating stronger harmonic suppression capability. Typical design targets range from ≥ 40 dB (basic requirement) to ≥ 60 dB (high-performance base station). Specification sheets often label this as "Stop Band Rejection" or "Attenuation."
2.3 Core Design Trade-off
Insertion Loss and Stopband Attenuation are not independent parameters — a fundamental design trade-off exists between them, as summarized in Table 1.
| Parameter | Insertion Loss (IL) | Stopband Attenuation (As) |
|---|---|---|
| Measurement zone | Inside passband | Inside stopband |
| Formula | −20·log₁₀|S₂₁| (in-band) | −20·log₁₀|S₂₁| (stopband) |
| Ideal direction | Lower is better (→ 0 dB) | Higher is better |
| Typical target | ≤ 0.5 dB (excellent); > 3 dB poor | ≥ 40 dB (basic); ≥ 60 dB (high-perf.) |
| Physical origin | Conductor loss, dielectric loss, mismatch | Reflection and cutoff beyond passband |
| Trade-off | Higher As requirements generally increase IL; both must be balanced within the system link budget | |
3. Design Techniques: Effect of Chebyshev and Elliptic Responses on Attenuation Characteristics
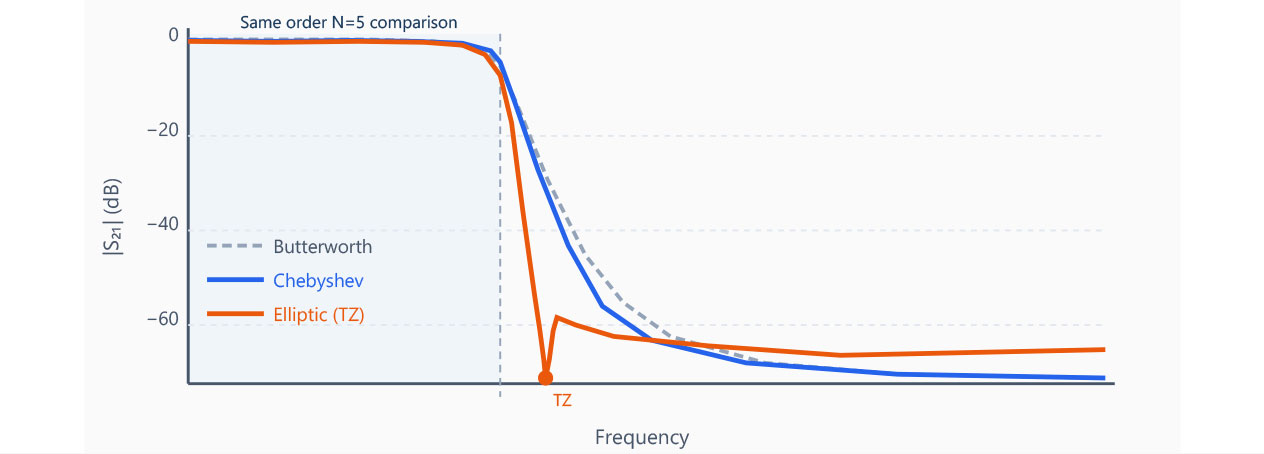
The transfer function design of a lowpass filter directly determines its attenuation characteristics. In practice, the Chebyshev and Elliptic (Cauer) responses are most commonly used. A comparison of their cutoff roll-off and stopband behavior is shown in Figure 2.
3.1 Chebyshev Response
The Chebyshev filter uses an equal-ripple design: the passband allows finite-amplitude ripple (typically 0.1–1 dB); stopband attenuation increases monotonically with no transmission zeros; cutoff slope is steeper than same-order Butterworth but not as steep as Elliptic. Attenuation function:
where T_N is the Nth-order Chebyshev polynomial and ε controls passband ripple. For Cavity LPFs, Chebyshev provides the most practical balance between passband ripple and stopband roll-off, making it the most common choice.
3.2 Elliptic (Cauer) Response
The Elliptic filter introduces finite Transmission Zeros (TZ) into the transfer function, achieving theoretically infinite attenuation at specific frequencies:
- Both passband and stopband have ripple (equiripple stopband)
- Transition band slope is the steepest of all response types — providing the fastest cutoff for the same order
- Phase linearity is the worst; unsuitable for systems with strict group delay requirements
3.3 Practical Selection Guidelines
| Characteristic | Butterworth | Chebyshev | Elliptic |
|---|---|---|---|
| Passband ripple | None (maximally flat) | Equiripple | Equiripple |
| Stopband ripple | None | None | Equiripple |
| Transition slope | Slowest | Moderate | Steepest |
| Transmission zeros | None | None | Yes (finite frequency) |
| Phase linearity | Best | Moderate | Worst |
| 5G harmonic suppression | General use | ⭐ Recommended | When steep near-cutoff rolloff needed |
Conclusion: 5G Cavity LPF design typically favors the Chebyshev response, providing sufficient stopband attenuation (≥ 60 dB) while maintaining low insertion loss. When an extremely steep transition band is required near the cutoff frequency (e.g., Sub-6 GHz closely adjacent interference bands), the Elliptic response is the more efficient choice.
4. Wide Stopband Implementation: Multi-Section Cascade and Spurious Frequency Management
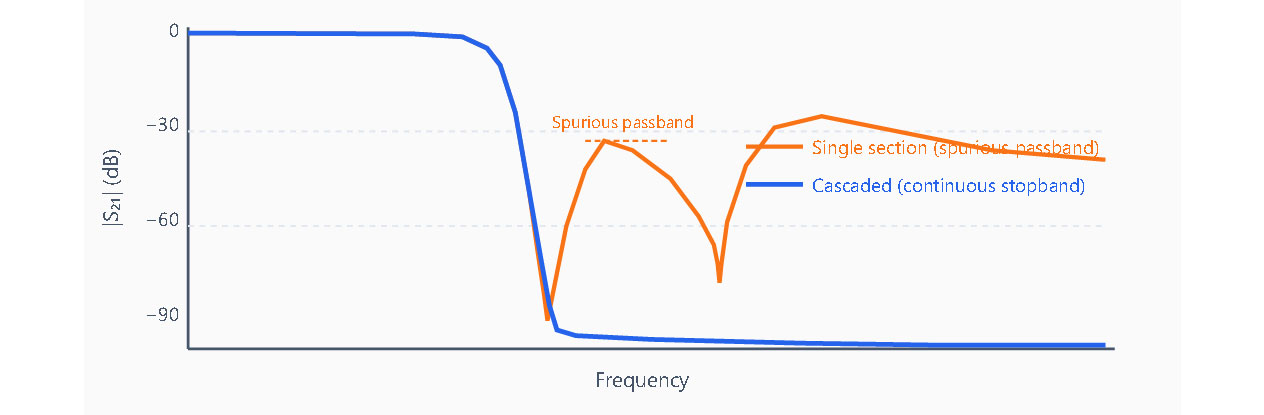
The stopband width of a single cavity resonator is naturally limited because the cavity itself has higher-order modes that form spurious passbands within the stopband, interrupting stopband attenuation. Achieving a "wide and continuous" stopband is one of the greatest engineering challenges in Cavity LPF design, as illustrated in Figure 3.
4.1 Method 1: Multi-Section Cascade
The most straightforward wide-stopband approach is to cascade two or more sub-filters, distributing their transmission zeros across different frequencies:
- Each additional order N adds approximately 20 dB/decade to the roll-off rate
- Cascading two complementary sub-filters distributes transmission zeros quasi-periodically across the entire stopband
- Trade-off: increased volume, higher insertion loss, greater sensitivity to manufacturing tolerances
Research from Cambridge indicates that arranging cavity elements in quasi-periodic arrays combined with TEM and TM coupled resonances can achieve an ultra-wide, continuously spurious-free stopband while maintaining low insertion loss.
4.2 Method 2: Spurious Mode Management
Higher-order spurious modes of cavity resonators (e.g., TE₁₀₂, TE₂₀₂) are the fundamental cause of stopband narrowing. Common suppression techniques include:
- Mode Staggering: Adjust individual cavity dimensions to offset the higher-order mode resonant frequencies of adjacent cavities, preventing spurious passbands from forming at the same frequency.
- Mixed EM Coupling: Select specific weak coupling points between electric coupling windows and magnetic coupling slots to selectively suppress particular higher-order modes.
- Orthogonal Feeding: Use orthogonal input/output port layouts at different layers to naturally block excitation of higher-order modes.
4.3 Method 3: Stepped Impedance Resonator (SIR)
By alternating high-impedance (High-Z) and low-impedance (Low-Z) transmission line sections, the spurious resonance positions can be artificially controlled, pushing parasitic passbands to higher frequencies and extending the effective stopband width. In 5G Sub-6 GHz applications, this is a practical approach for balancing size and stopband performance.
5. Temwell Case Study: Cavity Lowpass Filter Attenuation Specifications in 5G Transmit Paths
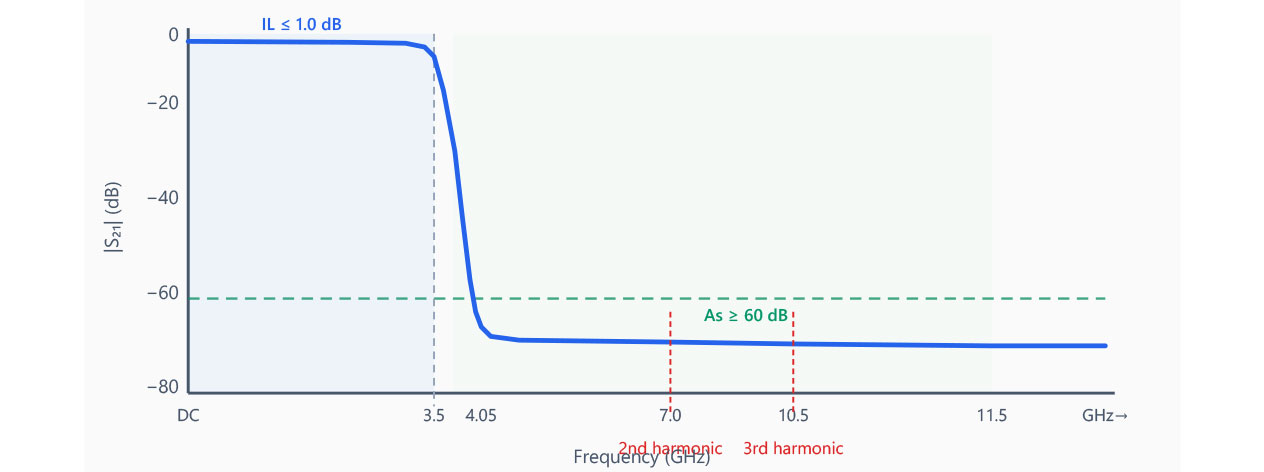
The Temwell Standard Cavity Lowpass Filter (STLP series) is designed for high-frequency applications above 1 GHz, covering a broad range from DC to 60 GHz. Figure 4 shows a representative S21 response for 5G Sub-6 GHz.
5.1 STLP Series 5G-Related Specification Comparison
| Model | Cutoff Freq. | Insertion Loss | Stopband Att. | Stopband Range | Application |
|---|---|---|---|---|---|
| STLP-DC-3.5GA57 | 3.5 GHz | ≤ 1.0 dB | ≥ 60 dB | 4.05–11.5 GHz | 5G NR Band n78 |
| STLP-DC-12.5GA73 | 12.5 GHz | ≤ 1.0 dB | ≥ 50 dB | 13.7–20 GHz | mmWave harmonic suppression |
| DC-200 MHz LC LPF | 200 MHz | ≤ 0.5 dB | ≥ 40 dB | 600–1000 MHz | Reference LC-type filter |
5.2 Specification Interpretation
Taking STLP-DC-3.5GA57 (3.5 GHz cutoff, corresponding to 5G NR Band n78) as an example:
- Insertion Loss ≤ 1.0 dB indicates minimal useful signal loss within the passband (DC–3.5 GHz)
- Stopband Attenuation ≥ 60 dB @ 4.05–11.5 GHz means from approximately 1.16× the cutoff frequency onward, all frequencies receive at least 60 dB attenuation, suppressing the 2nd harmonic (7.0 GHz) and 3rd harmonic (10.5 GHz) by more than 60 dB
- Stopband coverage extends to approximately 3.3× the passband frequency range, fully satisfying the 3GPP requirement to test up to 12.75 GHz
STLP-DC-12.5GA73 (12.5 GHz cutoff) provides IL ≤ 1.0 dB and stopband attenuation ≥ 50 dB @ 13.7–20 GHz, suitable for millimeter-wave harmonic suppression at the front end.
For comparison, the Temwell DC-200 MHz LC LPF offers IL ≤ 0.5 dB, stopband attenuation ≥ 40 dB @ 600–1000 MHz. The LC type is more compact but provides lower attenuation depth (40 dB) vs. the cavity type (60 dB), highlighting the superiority of cavity structures for high stopband attenuation requirements.
6. Measurement Verification: Reading S21 Stopband Data with a Vector Network Analyzer
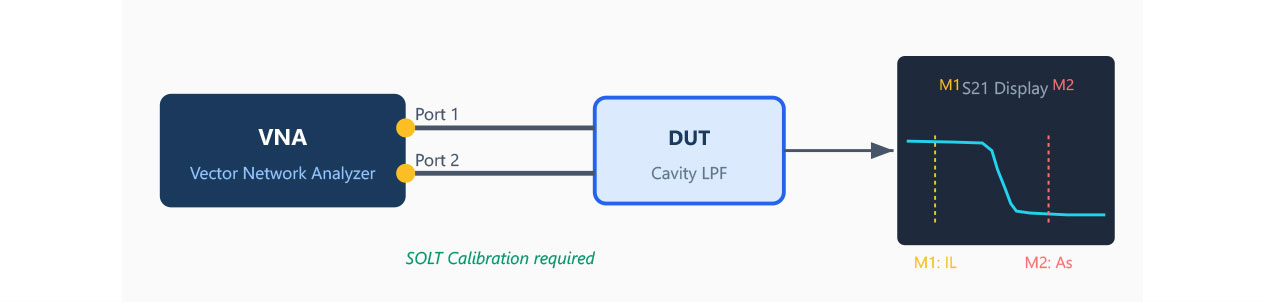
The attenuation performance of Cavity LPFs is primarily characterized via S-parameter measurements using a Vector Network Analyzer (VNA). The VNA is a two-port instrument that transmits swept-frequency signals of known power and simultaneously measures reflection (S11) and transmission (S21), fully describing the linear characteristics of the filter in complex form (magnitude + phase). The reading procedure and key markers are shown in Figure 5.
6.1 Stopband S21 Reading Procedure
- Calibration: Perform SOLT (Short-Open-Load-Through) or TRL calibration before measurement to eliminate parasitic effects from test cables and connectors.
- Frequency Range Setup: For 5G Sub-6 GHz Cavity LPFs, sweep from DC (100 kHz) to at least 15 GHz to cover the 4th harmonic and beyond.
- Dynamic Range Verification: When measuring ≥ 60 dB stopband attenuation, VNA dynamic range must be at least 80 dB (20 dB margin) to ensure results are not limited by noise floor.
- Reading Stopband Data: S21 in the passband should be near 0 dB (e.g., −0.8 dB indicates IL of 0.8 dB); in the stopband it drops sharply (e.g., −62 dB indicates stopband attenuation of 62 dB).
- Mark Key Points: Use Markers to identify the cutoff frequency (−3 dB point), the stopband start frequency, and the actual attenuation at each harmonic frequency.
6.2 Common Measurement Pitfalls
- Connector Leakage: When SMA connectors are not fully tightened, fixture leakage paths appear near the 60 dB attenuation level, preventing the stopband floor from meeting spec. Verify mechanical connection quality.
- Impedance Mismatch: If passband VSWR exceeds specification (e.g., > 1.5:1), IL will increase. Confirm the test environment matches the 50 Ω system impedance.
7. Conclusions: Attenuation Specification Recommendations
Defining the stopband attenuation specification for 5G Cavity Lowpass Filters requires simultaneous consideration of three dimensions: regulatory requirements, system link budget, and achievability.
7.1 Specification Framework
| 5G Band | Freq. Range | Rec. Cutoff | 2nd Harmonic | 3rd Harmonic | Rec. Stopband Coverage |
|---|---|---|---|---|---|
| Band n77 | 3.3–4.2 GHz | ≤ 3.3 GHz | 6.6 GHz | 9.9 GHz | Up to 12.75 GHz |
| Band n78 | 3.3–3.8 GHz | ≤ 3.5 GHz | 7.0 GHz | 10.5 GHz | Up to 12.75 GHz |
| Band n79 | 4.4–5.0 GHz | ≤ 4.4 GHz | 8.8 GHz | 13.2 GHz | Up to 12.75 GHz+ |
| Band n258 (mmW) | 24.25–27.5 GHz | ≤ 24 GHz | 48 GHz | 72 GHz | Up to 40 GHz+ |
7.2 Core Principles for Wide Stopband Design
- Prefer Chebyshev response: In Cavity LPF implementations, Chebyshev provides the best monotonic stopband attenuation and design predictability.
- Enhance transition band with transmission zeros: When an extremely steep transition band is required, use Elliptic or Generalized Chebyshev response to introduce finite transmission zeros near the cutoff frequency.
- Use multi-section cascades for wide stopband requirements: The effective stopband of a single section is typically 2–3× the passband frequency. When coverage to the 5th harmonic is required, a two-section cascade should be considered.
- Spurious modes are the primary design variable: Higher-order TE/TM modes form spurious passbands within the stopband; manage them through mode staggering, orthogonal feeding, or dimensional optimization.
- Measurement is more critical than simulation: Cavity machining tolerances (±0.1–0.3 mm), contact resistance, and surface treatment all affect actual stopband depth. All specifications must be verified by VNA measurement.
Summary: Stopband attenuation is not a single-frequency specification, but a systematic metric encompassing stopband start frequency, bandwidth coverage, and attenuation depth. With more than 25 years of RF filter production experience, Temwell possesses immediately deployable R&D capabilities in high-Q cavity design, spurious mode suppression, transmission zero placement, and VNA measurement verification — delivering customized Cavity Lowpass Filter solutions for 5G transmit paths that combine low insertion loss with wide stopband attenuation.
References
- Tektronix, "Spurious Emission Measurement on 5G NR Base Station Transmitters and Receivers," Application Note.
- 3GPP TS 38.104, "NR; Base Station (BS) Radio Transmission and Reception," Release 17/18.
- Temwell Corporation, "What Is Insertion Loss of RF Filters and Why It Matters," Technical Article, temwell.com.
- Temwell Corporation, "Customized Standard Cavity Lowpass Filter (STLP) Solutions," Product Page & Datasheets, temwell.com.
- J. Stiles, "Microwave Filter Design," University of Kansas (ITTC) course handout.
- Microwaves101, "Filter Response Types," Encyclopedia entry.
- P. Butzopulos, "Low-Pass Chebyshev Filter Based on Integrated Passive Device Technology," Theseus, 2023.
- "Chebyshev filter," Wikipedia.
- Mini-Circuits, "A Quick Guide to RF & Microwave Filter Topologies," Blog.
- "Multilayer Circular SIW Cavity BPF with Ultrawide Stopband Characteristics," Int. J. Microwave and Wireless Technologies, Cambridge.
- "New Coaxial Low-Pass Filters with Ultra-Wide and Spurious-Free Stopband," Int. J. Microwave and Wireless Technologies, Vol. 14, Issue 3.
- "Realization of a Wide Stopband Filter Using the Weakest Electric Field Method and EM Hybrid Coupling," Wiley, 2024.
- Temwell Corporation, "STLP-DC-12.5GA73 Low Pass Filter Specifications," Datasheet PDF.
- Temwell Corporation, "DC-200 MHz LC Low Pass Filter Preliminary Specifications," Datasheet PDF.
- Fujicrystal, "How to Measure SAW Filters: VNA S-Parameters & Group Delay."
- CERN Accelerator School, "RF Measurement Techniques," 2022 lecture (Indico).
- E. Musonda, "Design of Generalised Chebyshev Lowpass Filters Using Coupled Line-Stub Sections," White Rose, 2015.